Debugging with Xdebug
What is Xdebug and why use it?
In our Basic error hunting & prevention recipe, we introduced some functions like var_dump(), print_r() or error_log() to help debug your variables in PHP. While these functions are usually helpful for taking a quick look at the output of your variables, they are not useful for evaluating these variables at runtime, analyzing stack traces or setting breakpoints.
This is where Xdebug comes in, a PHP extension that provides debugging and profiling capabilities, which will finally speed up your development process, help you write better code and facilitate refactoring. With Xdebug, you can break code execution at any point, follow code execution step by step right from the beginning, and inspect all variables during a request.
In this recipe we will focus on Step Debugging with Xdebug.
Tools used in this recipe
- Xdebug 3
- Visual Studio Code (VS Code) as editor
- PHP Debug VS Code extension
- Kirby Starterkit
This recipe was tested on Mac OS Big Sur and Ubuntu 20.04 with Laravel Valet and Valet Linux, respectively.
Installing Xdebug
Note: In some development environments, Xdebug already comes bundled, so you don't have to install anything.
- Laravel Herd: In the free version, you need to enable it manually. The Pro Version can detect it automatically.
- DDEV: Xdebug is integrated
- MAMP Pro: Xdebug comes bundled, but needs to be enabled
Check if Xdebug is already installed
Let's first check if Xdebug is already installed on your system. You can check this by either putting a phpinfo() statement into a Kirby template or into a separate file and look for the xdebug section, or open a terminal and type
php -von the command line. If Xdebug is installed, this command will output something like:
PHP 8.3.30 (cli) (built: Jan 17 2026 00:18:43) (NTS clang 15.0.0)
Copyright (c) The PHP Group
Zend Engine v4.3.30, Copyright (c) Zend Technologies
    with Xdebug v3.5.0, Copyright (c) 2002-2025, by Derick Rethans
    with Zend OPcache v8.3.30, Copyright (c), by Zend Technologies
Installation instructions
You can find the installation instructions for your platform in the official Xdebug documentation.
There's also a wizard where you can enter the output of your phpinfo() to get instructions to build Xdebug from source for your environment.
Once Xdebug is installed, we have to set some configuration settings.
Configuration
The first step to configure Xdebug is to find the .ini file for your current PHP version. Here again, you can either find the paths to all used files via phpinfo() or via the CLI.
With
php --iniyou get a list of all .ini files used. Sometimes, there is only one .ini file, sometimes there is one for each loaded extension.
With phpinfo(), you find the information at the top of the output in the fields
- Configuration File (php.ini) Path
- Loaded Configuration File
- Scan this dir for additional .ini files
- Additional .ini files parsed
If you find a specific .ini file for Xdebug, you will work with this file, otherwise, use the main .ini file. If a directory is listed in "Scan this dir for additional .ini files", you can also create a file for Xdebug yourself to keep your main php.ini clean.
Check if the file you are working with already contains the configuration for the Xdebug extension (in my environments, this line was added automatically when I installed Xdebug):
zend_extension=path/to/where/you/installed/xdebug.soIf not, add this line now, and restart your server. Verify that Xdebug is properly running by checking again with phpinfo() or php -v as explained above.
We now have to add some more config settings. Add the following settings to the same .ini file:
zend_extension=path/to/where/you/installed/xdebug.so
xdebug.mode=debug
xdebug.start_with_request = yes
xdebug.client_port = 9003
xdebug.client_host = localhost
xdebug.idekey = VSCODE
Note that 9003 is the default port. If this port is used by another service on your system, change it to an unused port.
After adding these settings, restart your webserver again.
You can find a description for all config settings in the Xdebug docs.
In this recipe, we assume that your tested code and Xdebug run on the same server.
There are multiple ways to tell Xdebug how to connect to a remote debugger as described in the Xdebug documentation, but we stick with the start_with_request method recommended by the plugin we will install in the next step.
Installing the VS Code extension
To make Xdebug work with VS Code, we need to install the PHP Debug extension by Felix Becker. Since we already installed Xdebug and configured the required .ini settings above, there is no further configuration needed at this point.
Once this is done, we are ready to start our first debugging session.
Debugging our first Kirby controller
Now for the fun part. Download and open a Kirby Starterkit in a new VS Code window.
To bring up the Run View, click on the Run icon in the VS Code Activity Bar on the left side of VS Code, or press CMD-SHIFT-D (Mac)/CTRL-SHIFT-D (Linux/Windows). In Run view, click Create a launch.json file and then choose PHP from the environment dropdown:
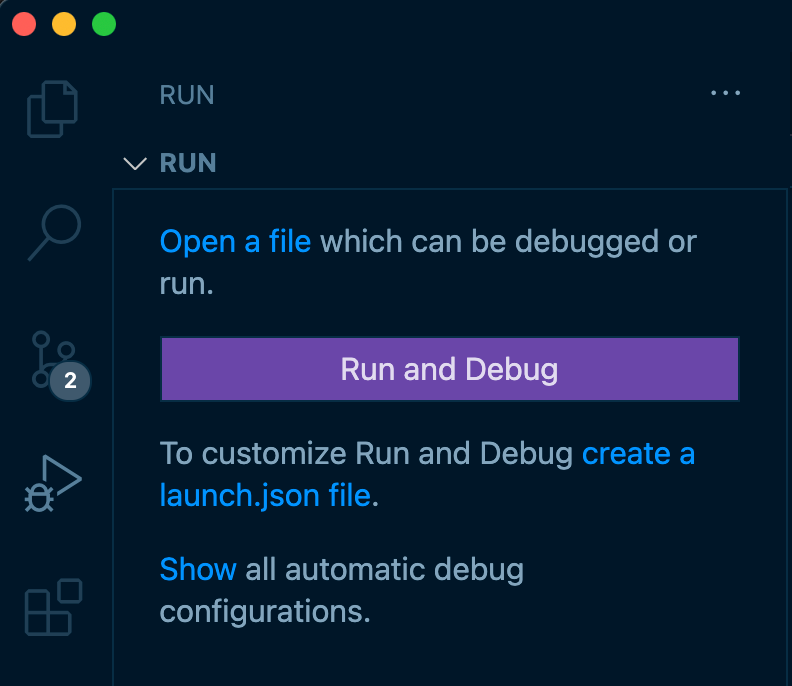
A new launch.json file with default settings is created in the project folder.
We now have to change the port settings for both configurations in this file to what we entered in the php.ini file. Since I stuck with the default port, this is port 9003. Since the second configuration "Launch currently open script" is not relevant for the purposes of this recipe, I didn't copy it here.
{
    "version": "0.2.0",
    "configurations": [
        {
            "name": "Listen for XDebug",
            "type": "php",
            "request": "launch",
            "port": 9003
        }
    ]
}
For details of available launch.json settings, check out the PHP Debug documentation.
Adding breakpoints
To add breakpoints, click in the left-hand gutter of the code.
Open the site/controllers/notes.php controller and set three breakpoints on $tag and the two $notes variable definitions. A red dot will mark each breakpoint.

When PHP executes a line that has a breakpoint on it, Xdebug will step in and pause execution allowing you to gain valuable insight to all that is happening during execution.
Start listening to the debugger
Now open the debug panel again and click on the little green triangle to start listening for Xdebug. You will notice this new debug toolbar at the top of the editor window:
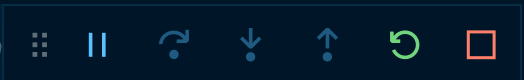
We will explain the different buttons in this toolbar below.
Next, open the notes page of the Starterkit in your browser. If all went well, you will be switched back to the VS Code editor, with the formerly empty debug panel now filled with information.

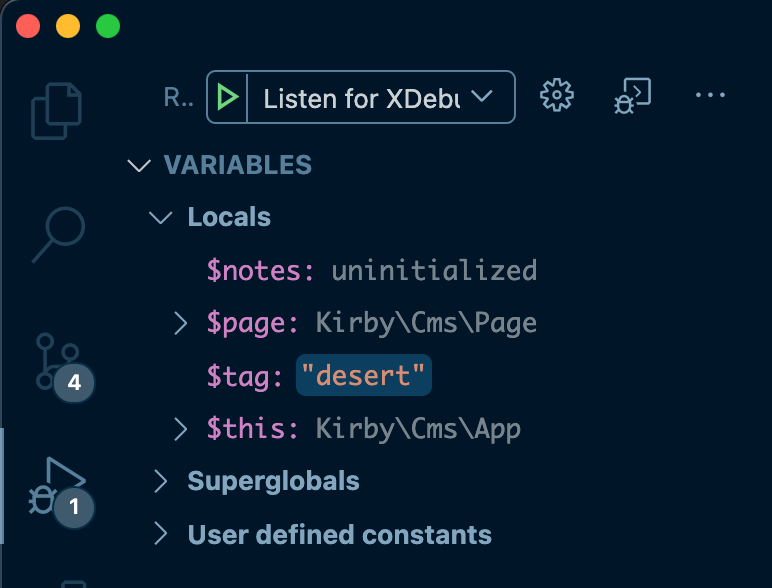
In this first step, the $notes and $tag variable are still uninitialized.
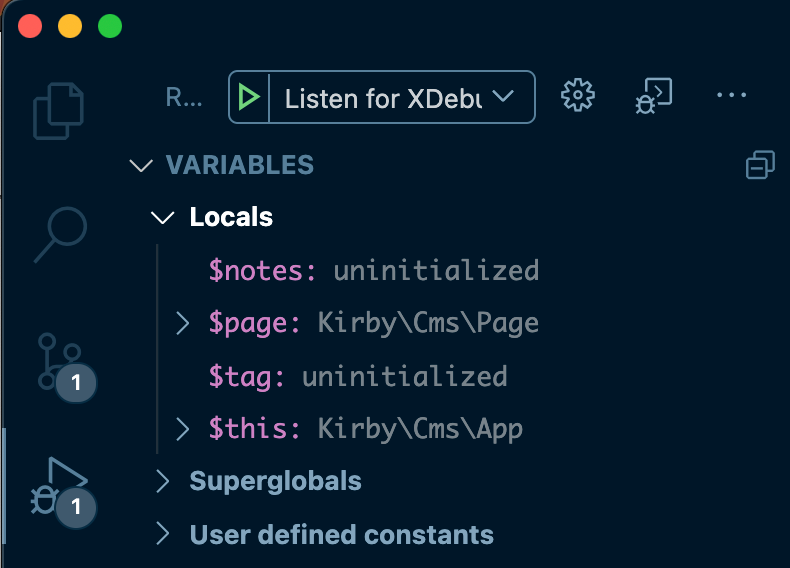
If we now click on Step over in the debug toolbar (or press F10), we can see how the content in the debug panel changes. Now the $tag variable is no longer uninitialized, but changes to an empty string.
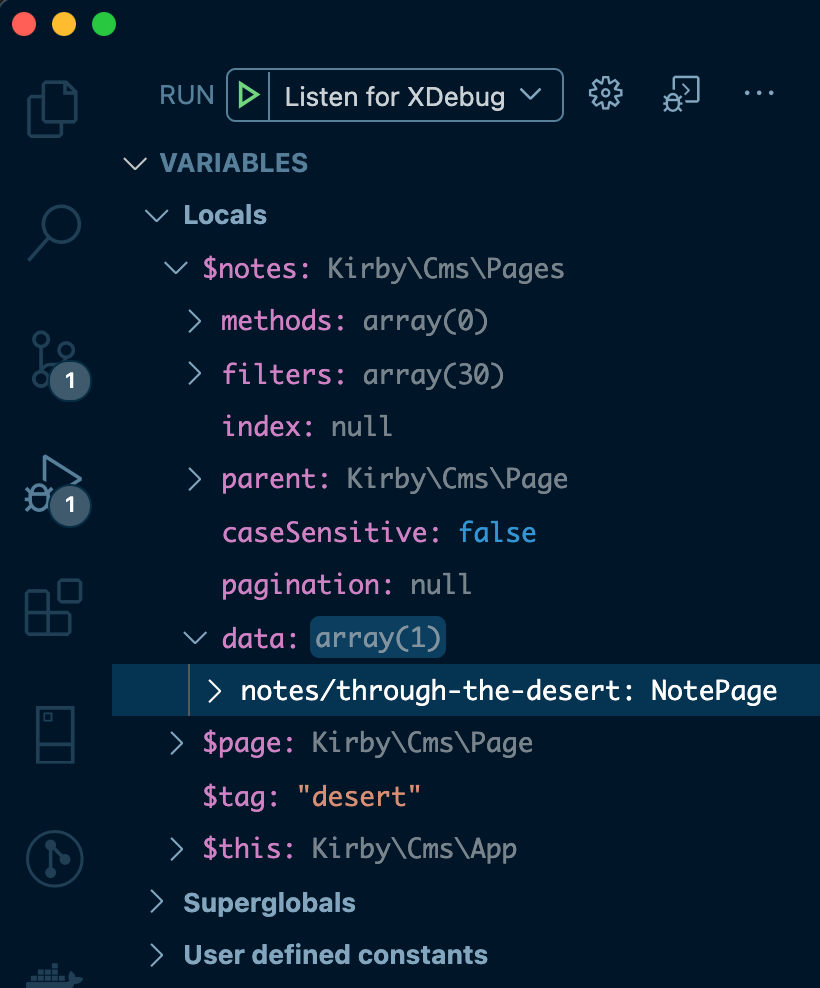
If we use Step over again, we will now see how the $notes variable has changed:
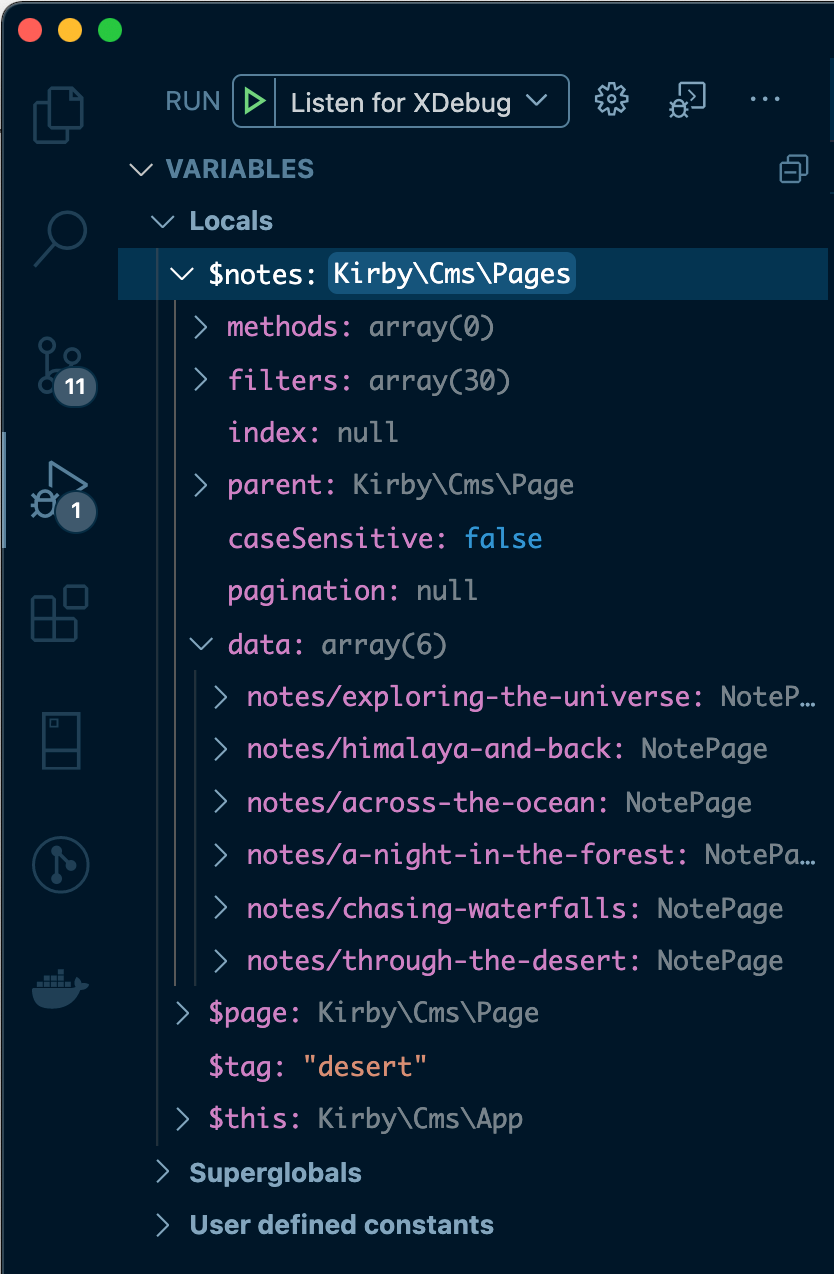
We can now inspect this variable in detail. We learn that the variable contains an object of type Kirby\Cms\Pages, that the data array contains the subpages and a lot more.
With the debugging listener still active, let's return to the browser and add a tag in the address bar, e.g http://yourlocaldomain/notes/tag:desert. Now reload the page in the browser and return to the editor.
Notice how after the first Step over, the $tag variable now contains the string desert. Step over again, and the $notes variable will still be the same as before.
With the third step over, we will reach the if statement and another step forward, we will notice that the $notes variable has now changed. The data array inside the variable now only has a single item, whereas it had 6 before the filtering took place.
Get out of debug mode by clicking on Stop in the debugging toolbar and remove all breakpoints.
Error debugging
Up to this moment, we haven't run into any errors. Let's change that by deliberately changing our code to make it likely to run into an error, and see what happens.
We make the following changes in the Starterkit:
-
In
site/models/note.phpremove or comment out thecover()function -
Change
/site/snippets/note.phplike this:<article class="note-excerpt"> <a href="<?= $note->url() ?>"> <header> <figure class="img" style="--w: 16; --h:9"> <?= $note->cover()->toFile()->crop(320, 180) ?> </figure> <h2 class="note-excerpt-title"><?= $note->title() ?></h2> <time class="note-excerpt-date" datetime="<?= $note->published('c') ?>"><?= $note->published() ?></time> </header> <?php if (($excerpt ?? true) !== false): ?> <div class="note-excerpt-text"> <?= $note->text()->toBlocks()->excerpt(280) ?> </div> <?php endif ?> </a> </article>
What do we do here? We call toFile() on the cover field to try and create a file object from the field value, and then call the crop() method on the result.
Now let's set a breakpoint on the line
<?= $note->cover()->toFile()->crop(320, 180) ?>Go into debug mode again and reload the notes page in the browser (without the tag parameter).
If we step over the breakpoint for the first time, all is well. Now hit the Step over button until you see an error appear in the Variables tab (which should happen on the next iteration of the foreach loop).
The next time we hit the breakpoint, we will get the following error message:
Error
type: Error
message: "Call to a member function crop() on null"
What does this mean? On the second iteration of our loop, we obviously don't have a file object on which we could possibly call our crop() method.
This is actually a typical error that happens when we call a method that requires an object of a given class to exist. However, when - as in this case - the field is empty or the file reference in the field doesn't exist anymore, there is no object on which we could possibly call the crop() method.
With these first steps, you now have a working Xdebug environment set up and running, and can start venturing further on your own.
Before we come to an end though, let's have a brief look at the other areas in the debug panel.
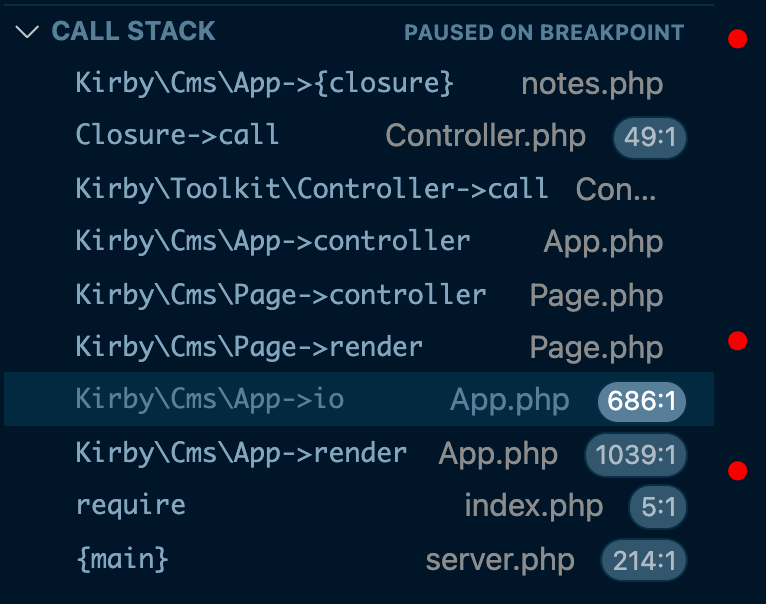
Call Stack tab
In the Call Stack tab, you see an interactive history of the chain of methods that have been executed up to the current breakpoint or current point of the execution.
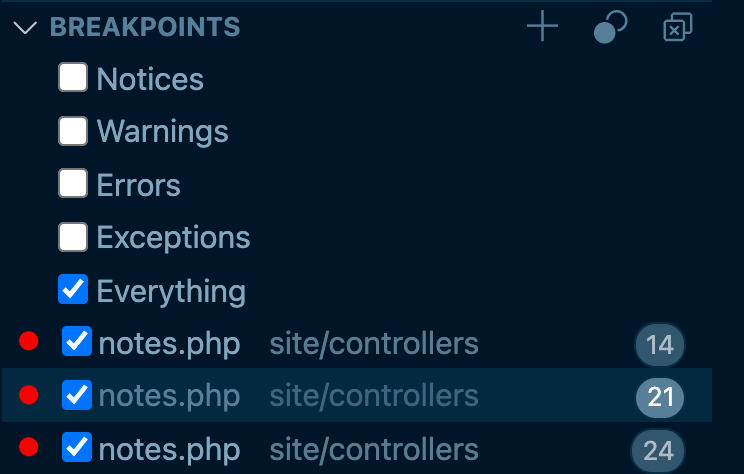
Breakpoints tab
In the Breakpoints tab, you can set the level of errors that Xdebug will log (Warnings, Errors etc.), temporarily disable or remove all breakpoints at once, or disable, remove or add breakpoints.
The debug toolbar
When in debug mode, you get a debug toolbar for controlling the execution of the code.
- Pause: Pause execution (not available during debugging)
- Continue: Continue with PHP execution (leave debug mode)
- Step Over: Execute script and move to the next line of the file
- Step Into: If the next line has one or more functions, move the debugger into those to step through
- Step Out: Move the debugger out of the current function back to the function that called it
- Restart: Restart debugging
- Stop: Stop debugging
